What is data journalism at the Guardian?
It is the telling of story using the power of data. The use of key information stats, key data, key reference elements to inform a story. It’s not just obtaining data and putting it out there, it’s the processing that goes into it that tells you what it’s about and you have to ask the right questions. It can be an interactive map or clear picture. It helps you tell a story in a way where the audience can understand it. The recognition of power of measurement in helping public conversations. Numbers are so strong, it’s a modern way of doing journalism. The only way to get the best stories now is to involve what statistician use now. 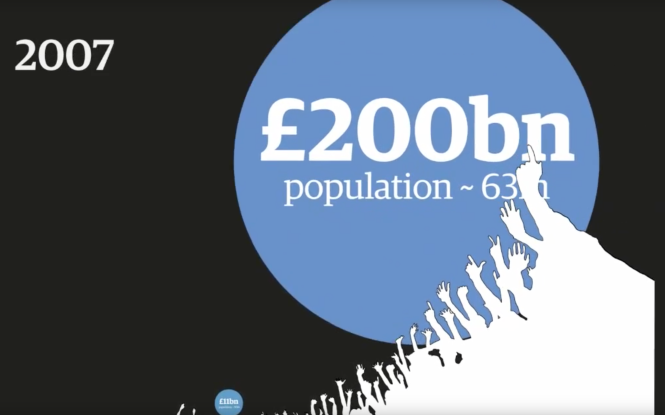
2007 Population image sourced from theguardian What is Data Journalism? Documentary
Data journalism drives policy, provides evidence both politically and in the public discourse. It’s about analysing and pulling data together in order to find the truth in a story.
Data Journalism in action: The London Olympics
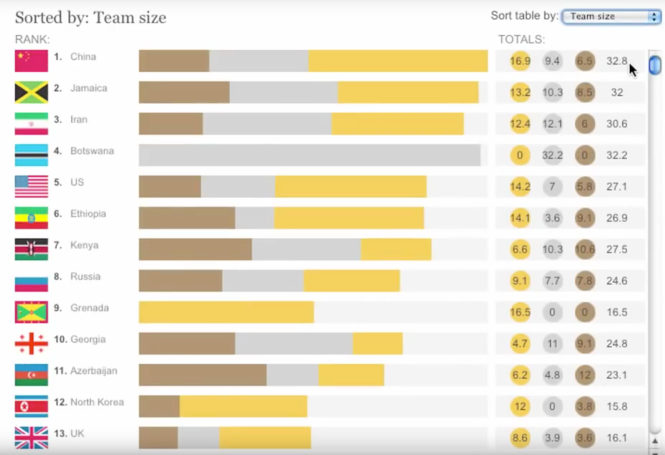
London Olympics Rank image sourced from theguardian in Data Journalism in Action: The London Olympics Documentary
With the Olympics, people are obsessed with performance medals (Who’s got the most medals). You have to pay a lot of money to obtain live data. Data journalism provided solutions to the question “If pourer countries won 5 gold metals vs. a richer country earning 5 gold medals, how much would they’re worth be and would the richer country be penalized? Through interactive design. It ran off google spreadsheet so updating numbers ever day changed graphs live each day. As soon as you present something in numbers, the public tends to have a conversation about it. Population adjusted figures triggered conversations about economics, size of population, and the questioning of why? Data allowing it’s audience to explore endless content marks data journalism.
