Wrangling Data
From a study on 35 WSU Design students who had logged 30 minute increments of their circadian cycles over 7 days, a formula was generated to determine their sleep behaviour against their studying progress on a hourly, daily, and weekly basis.
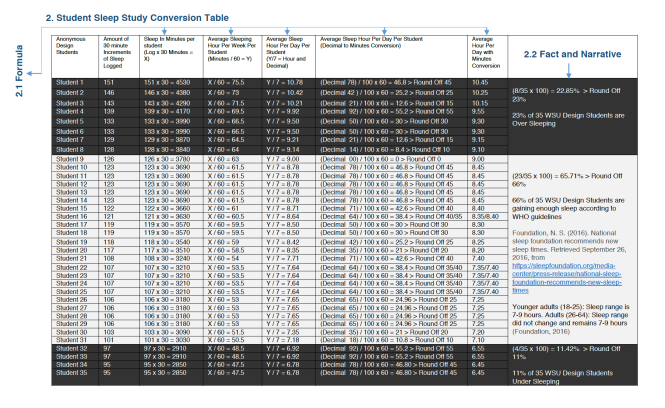
Sleep Conversion Table and Formula created by the owner of this blog
The statistics generated would then be imported into Tableau to generate a visual data narrative to find out if there are correlations between sleep deprivation against a lack in study productivity. The raw data acts as the skeleton of empirical findings and is a necessary step prior to graphic composition.
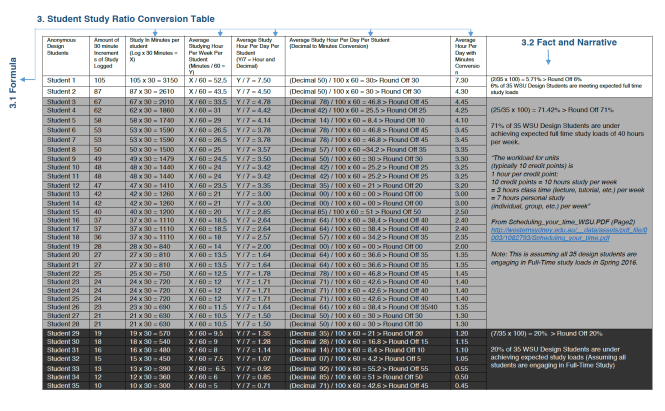 Study Conversion Table and Formula created by the owner of this blog
