Tableau Sleep Data Analysis Algorithm (Continued)
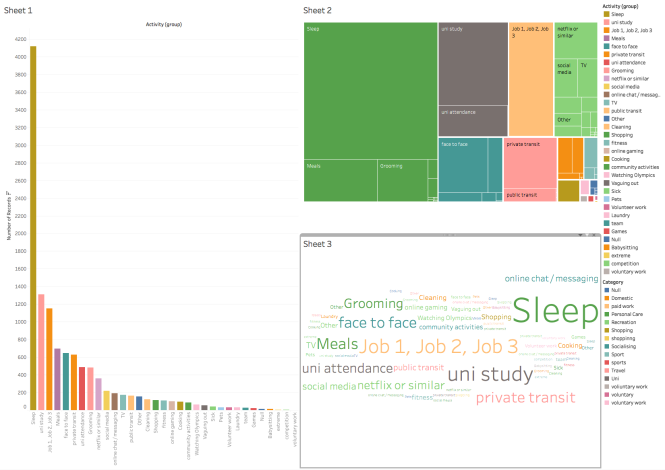
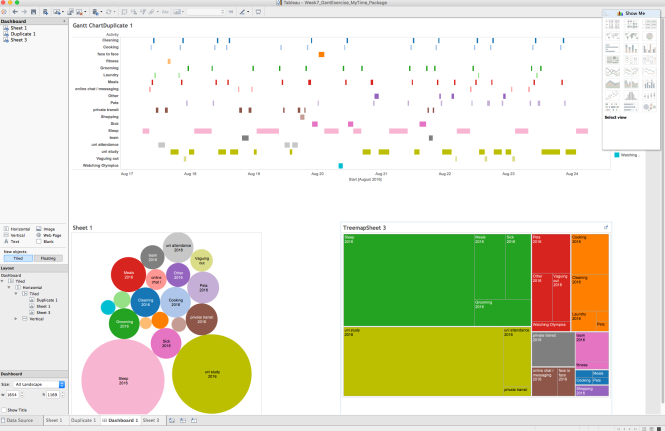
Tableau allows users to narrow specific factors of sleep and study patterns by isolation features. The sorting function by ascending or descending order creates a seamless visual to read.

Tableau screenshot sourced by the owner of this blog
Narrative Source
In junction with existing studies on recommended sleeping hours, a narrative soon appears with suggestions of how many students are deprived of sleep, getting enough sleep, and oversleeping.

Average Sleep Needs by Age Table sourced from helpguide.org
Average Sleep Needs by Age Graph from: http://www.helpguide.org/
Article: How much sleep do you need?
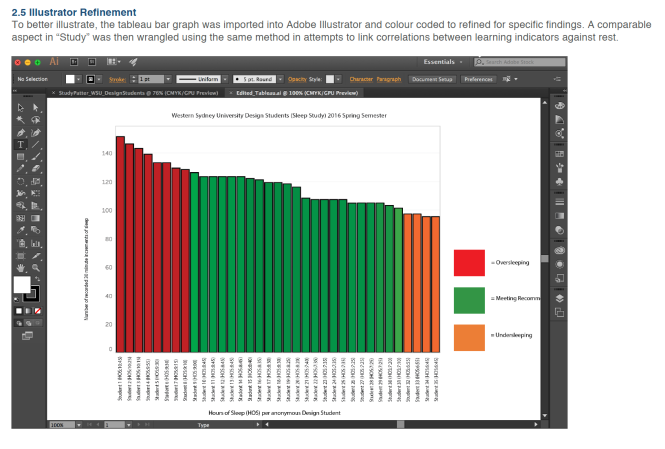
Adobe Illustrator screenshot sourced by the owner of this blog
Further reworking existing templates imported from Tabluea, the adobe Illustrator WSU student hours of sleep and study graph was generated
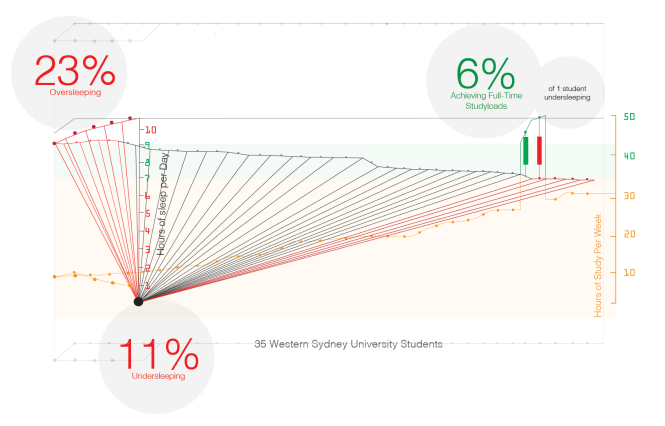
Western Sydney University student hours of sleep and study graph designed by the owner of this blog
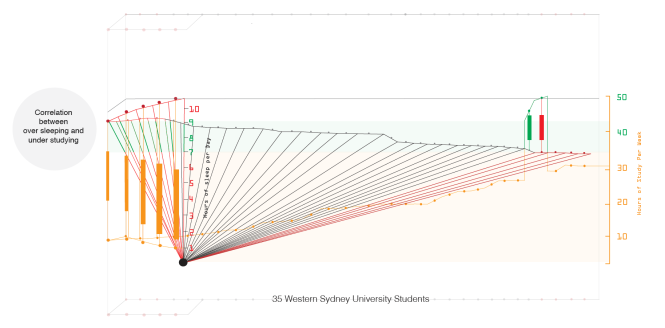
Western Sydney University student hours of sleep and study graph designed by the owner of this blog
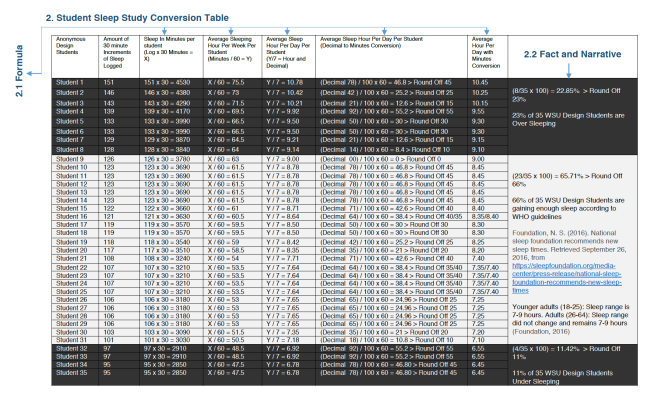
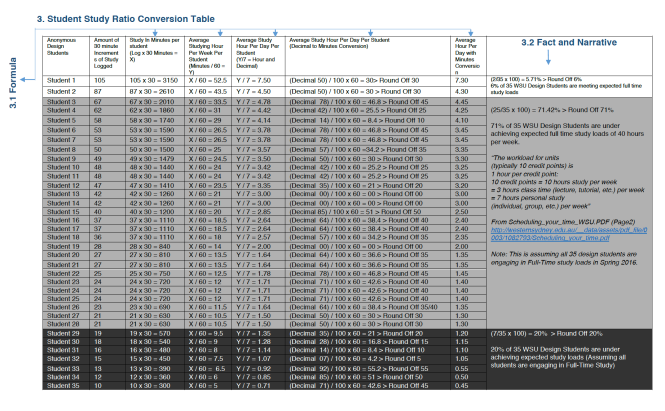 Study Conversion Table and Formula created by the owner of this blog